Analyze a single experiment
After running an experiment, you can use the LangSmith experiment view to analyze the results and draw insights about how your application is performing.
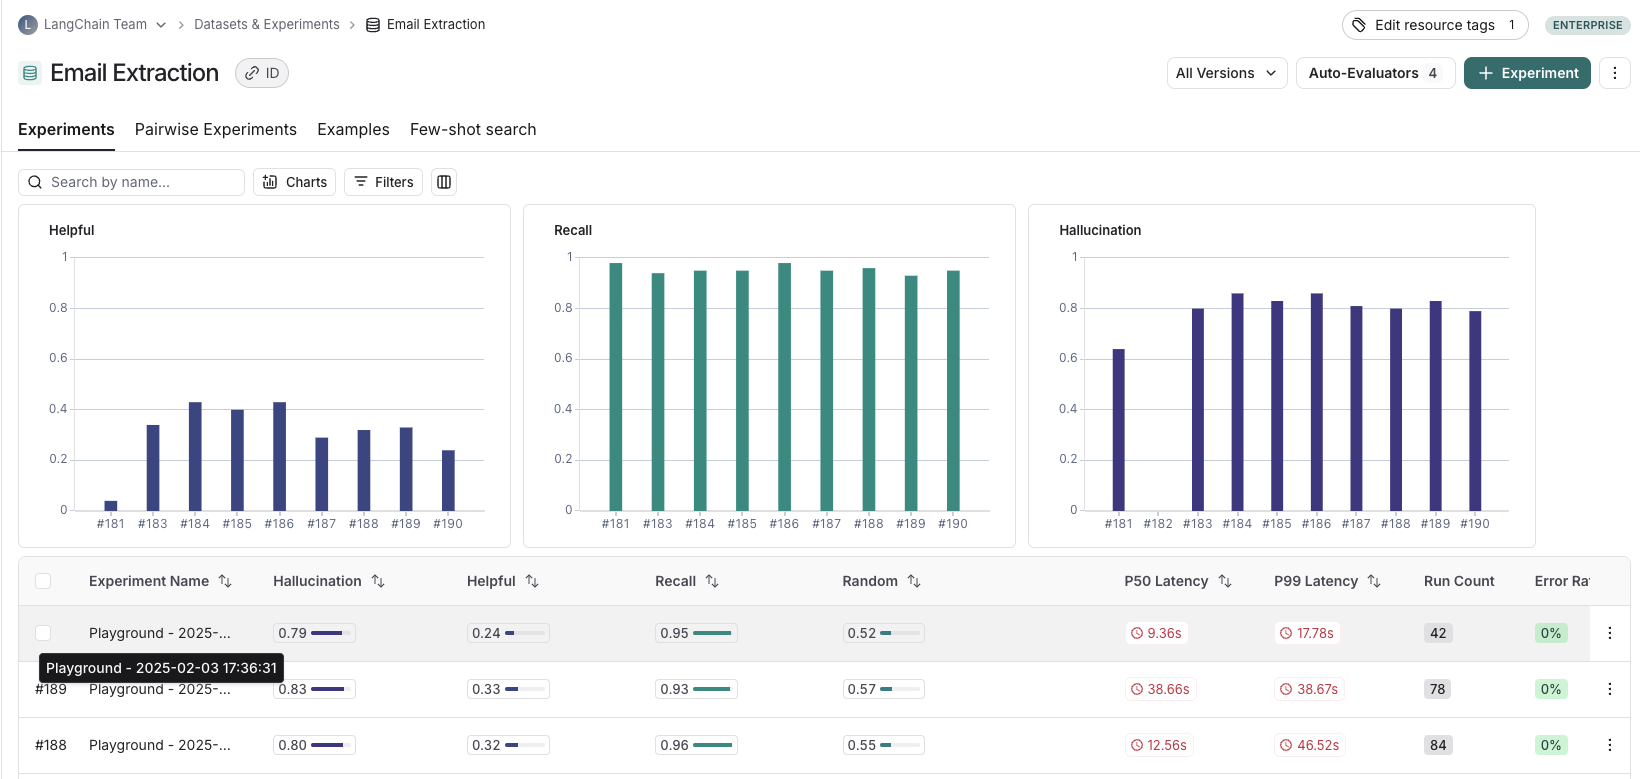
Open the experiment view
To open the experiment view, select an experiment from the "Experiments" tab from a given dataset page.
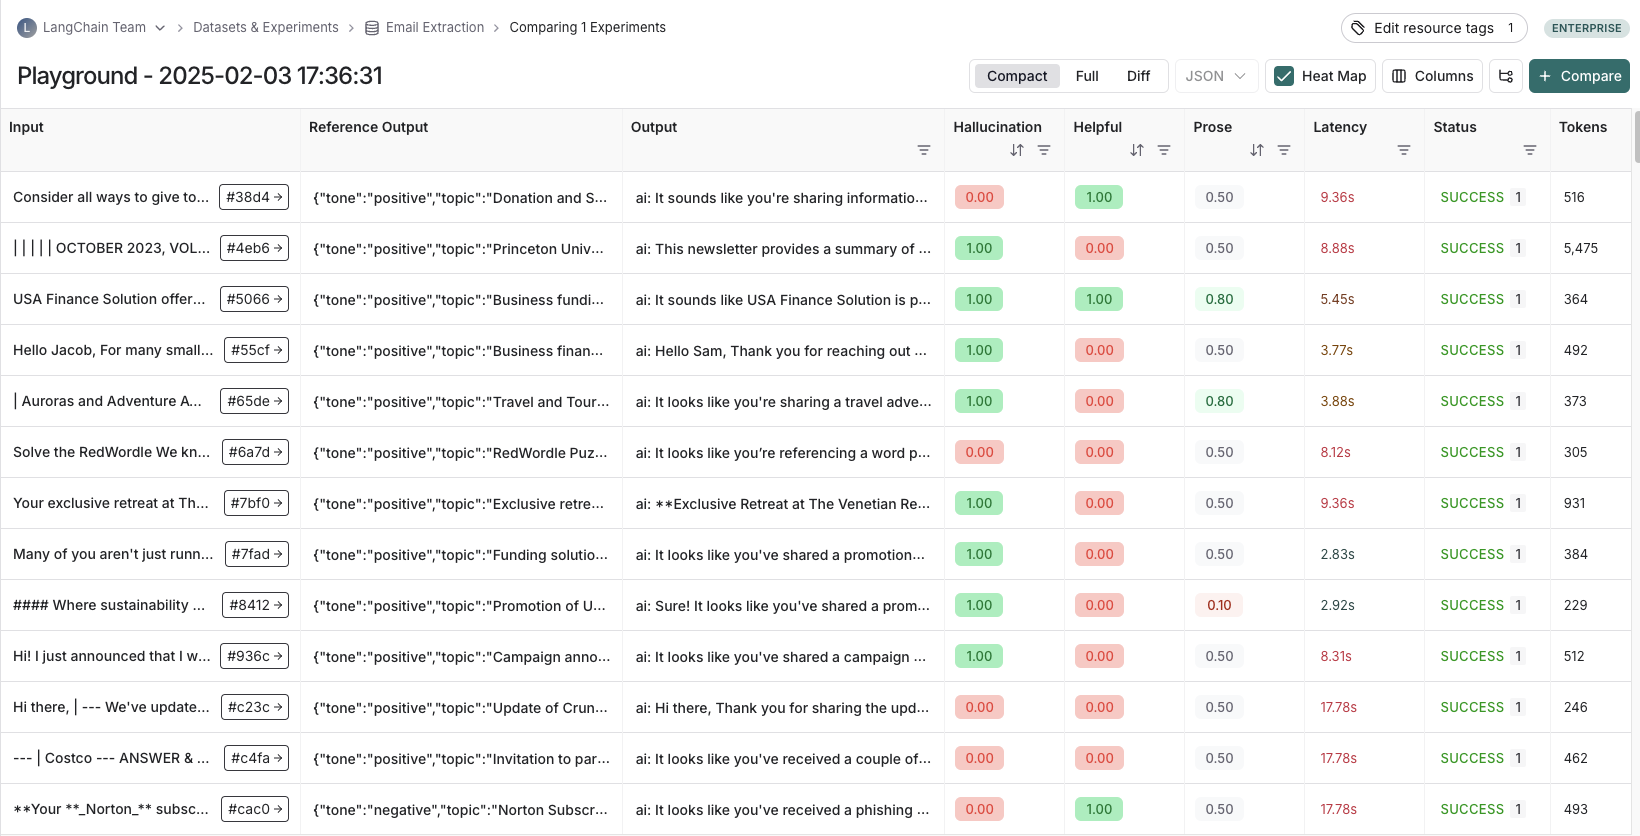
View experiment results
You can view the results of the experiment in the table view. This will show the input, output, and reference output for each run.
Each feedback key will be displayed in a separate column. These are the feedback scores from any evaluators you have run on the experiment. Each of the metrics (latency, status, cost, and token count) will also be displayed in individual columns.
In the columns dropdown, you can choose which columns to hide and which to show.
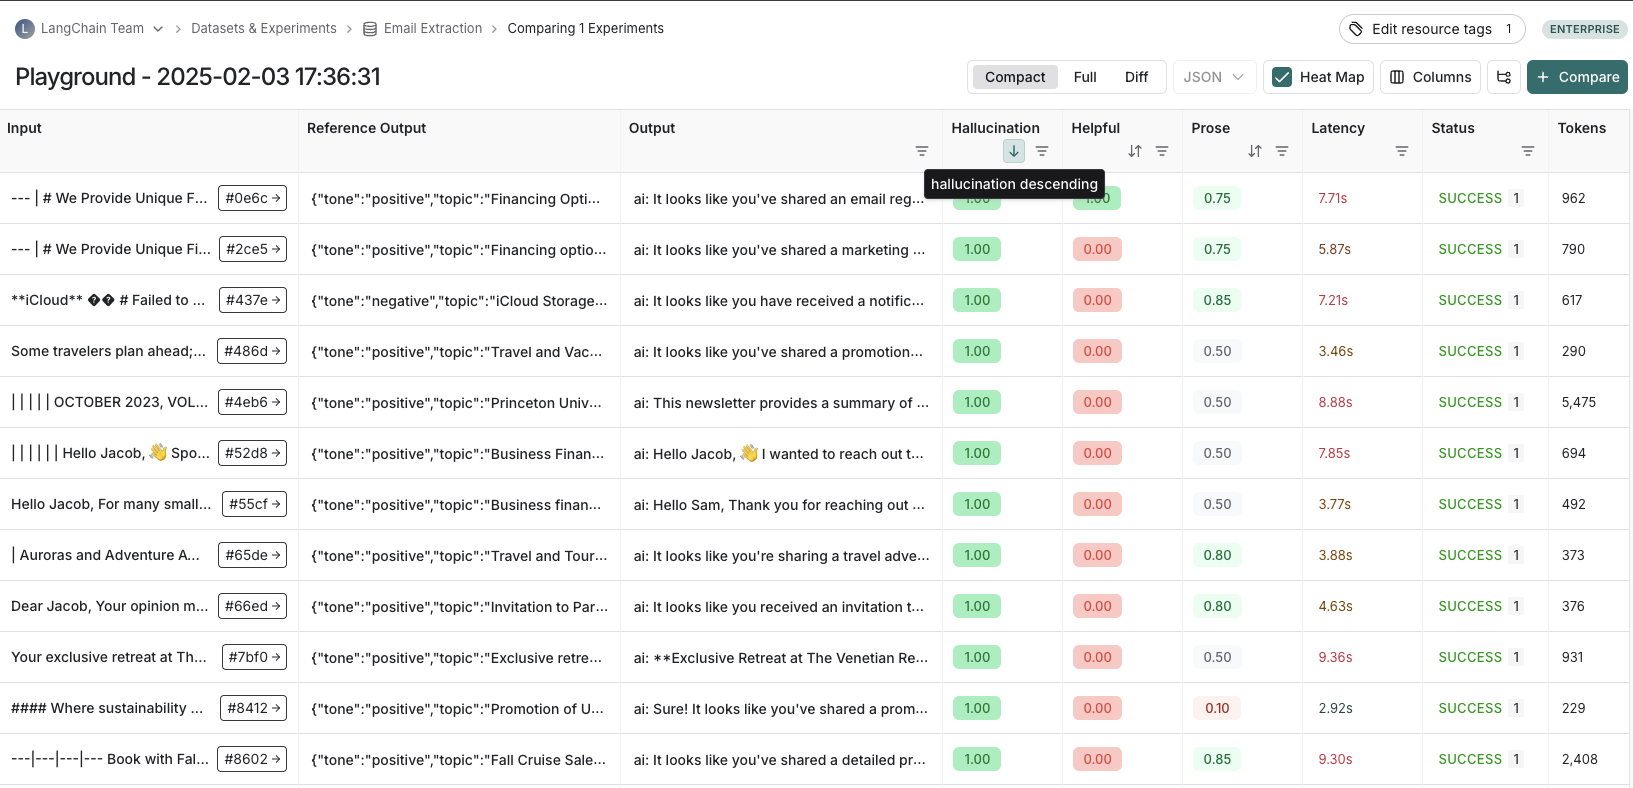
Sort and filter
To sort or filter results, you can use the actions in the column headers.
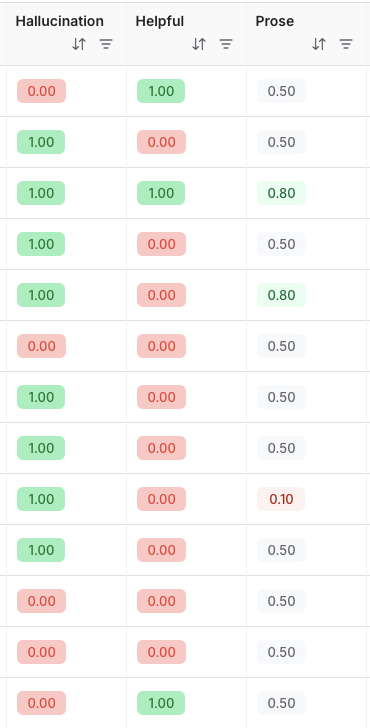
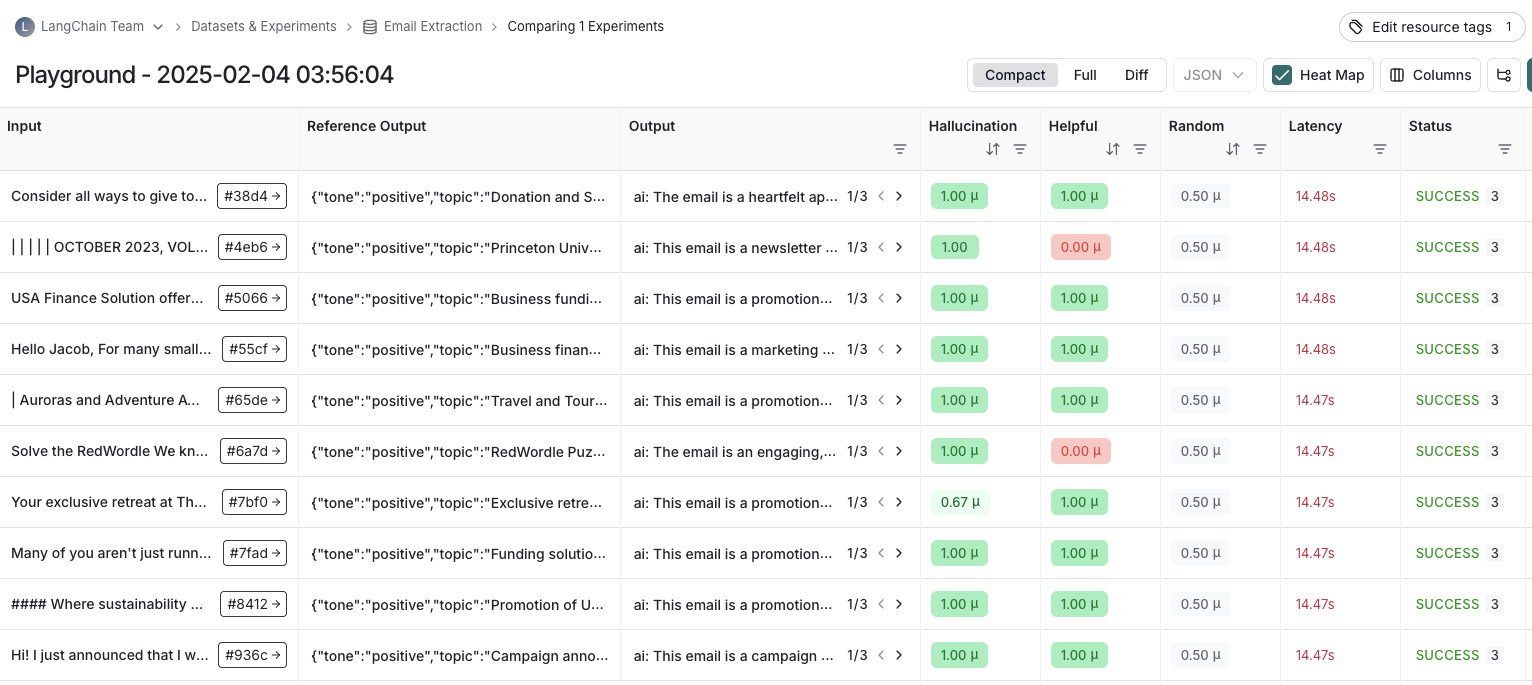
Heatmap view
The experiment view defaults to a heatmap view, where feedback scores for each run are highlighted in a color. Red indicates a lower score, while green indicates a higher score. The heatmap visualization makes it easy to identify patterns, spot outliers, and understand score distributions across your dataset at a glance.
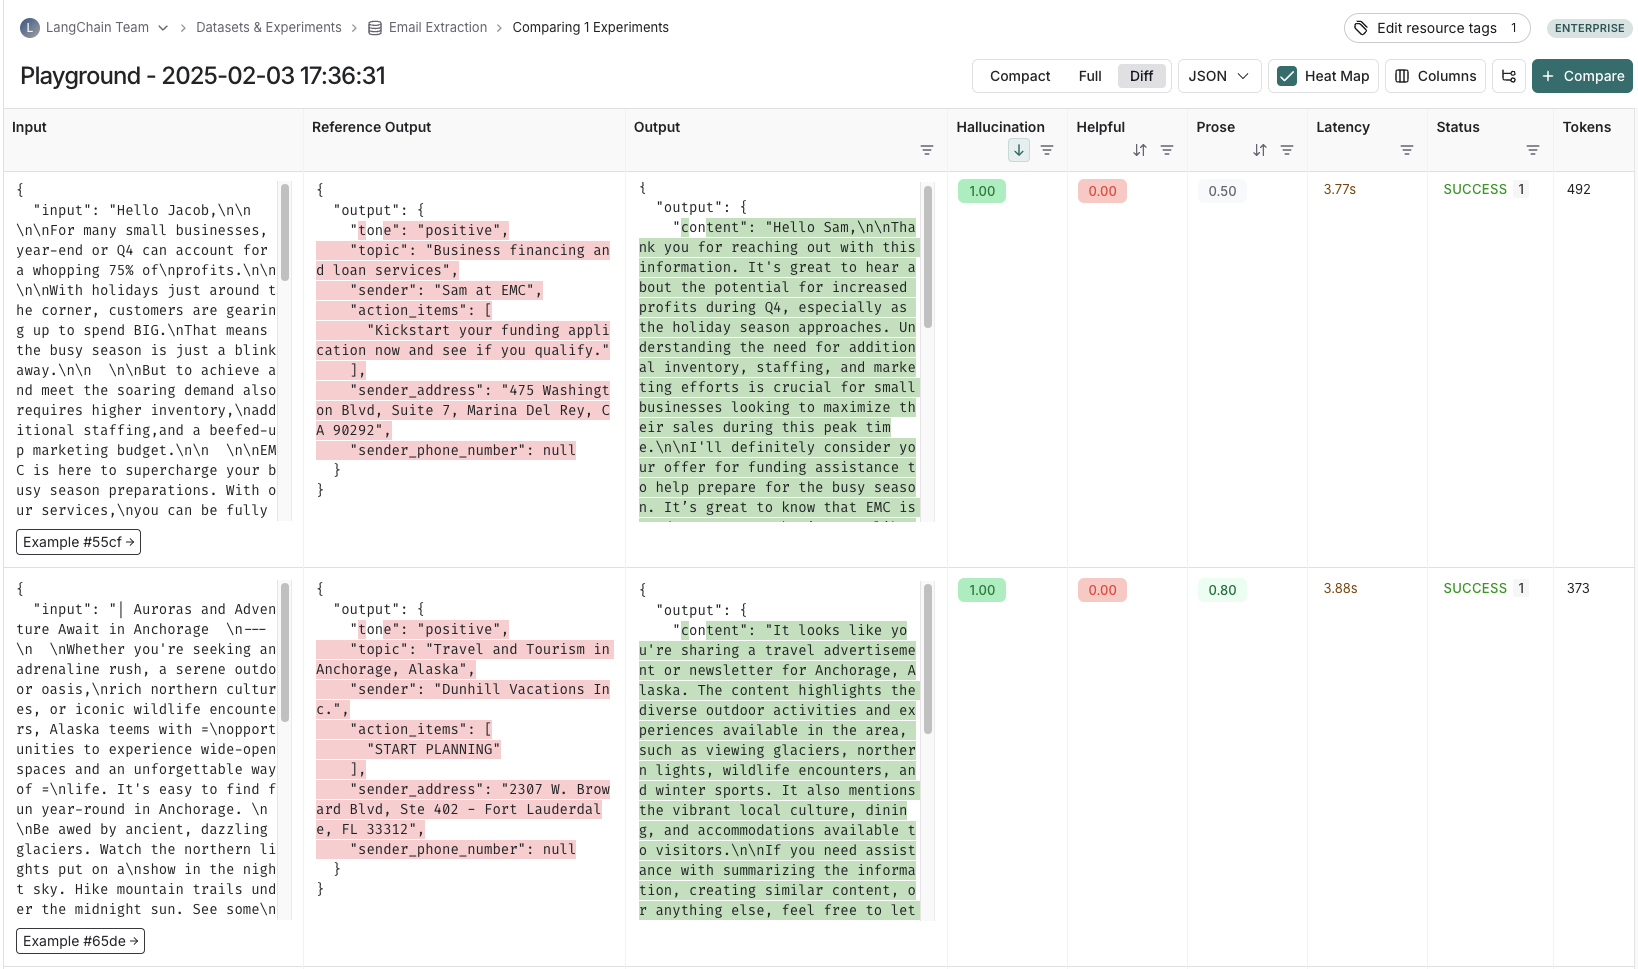
Diff view
You can toggle the view between a compact view, a full, view, and a diff view.
- The
Compactview shows each run as a one-line row, for ease of comparing scores at a glance. - The
Fullview shows the full output for each run for digging into the details of individual runs. - The
Diffview shows the text difference between the reference output and the output for each run.
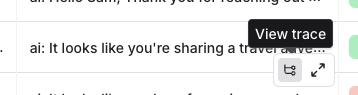
View the traces
Hover over any of the output cells, and click on the trace icon to view the trace for that run. This will open up a trace in the side panel.
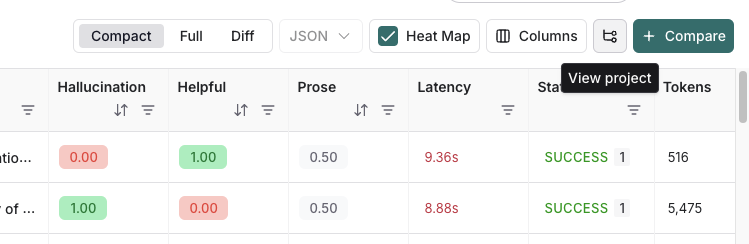
To view the entire tracing project, click on the "View Project" button in the top right of the header.
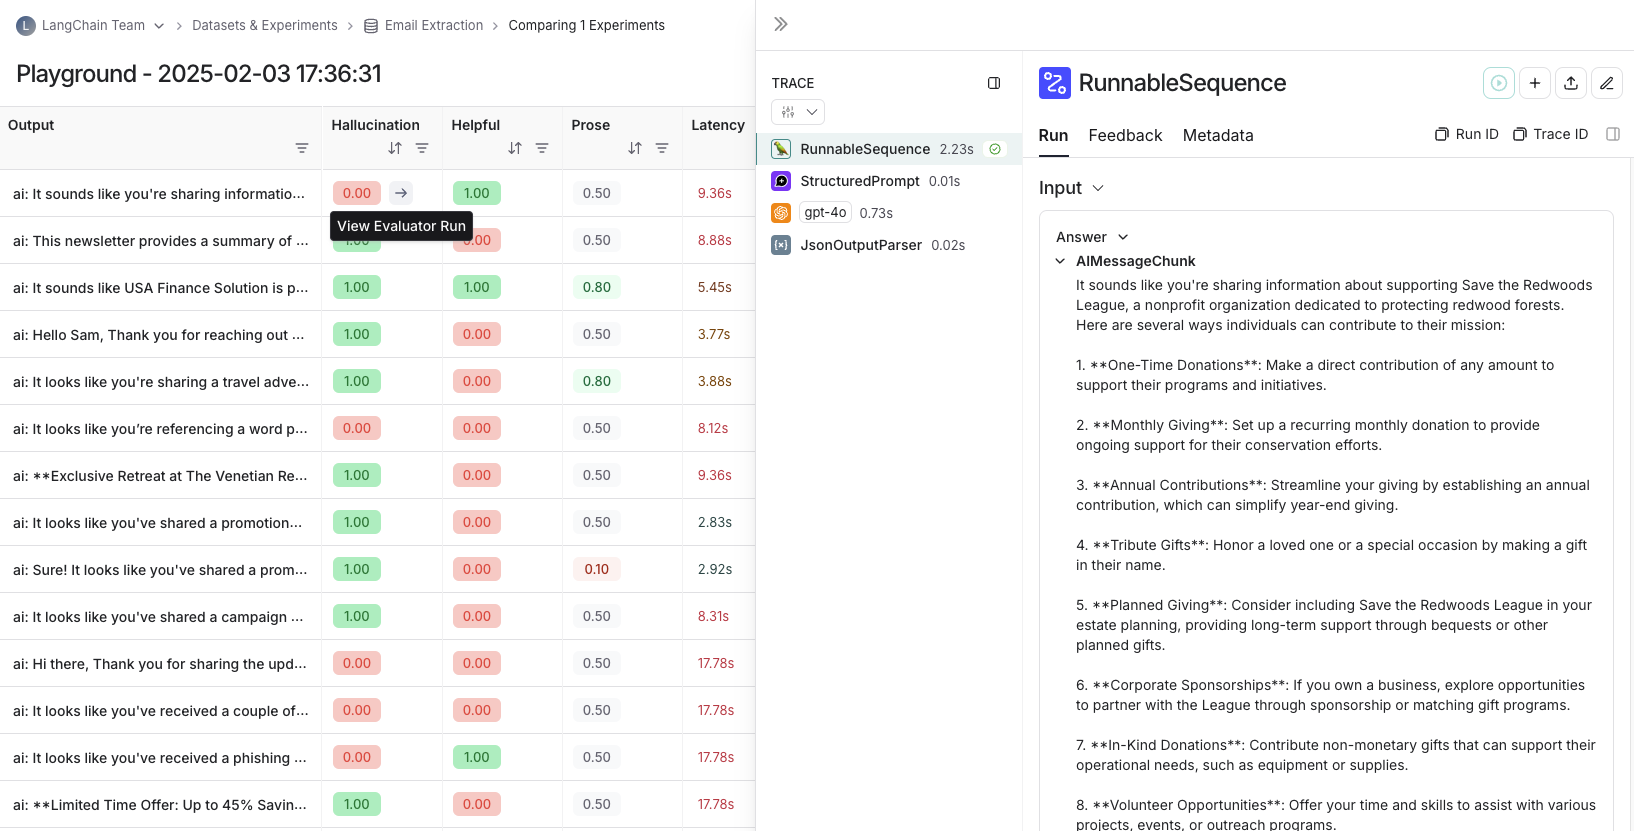
View evaluator runs
For evaluator scores, you can view the source run by hovering over the evaluator score cell and clicking on the arrow icon. This will open up a trace in the side panel. If your experiment has repetitions, you can click on the aggregate average score to find links to all of the individual runs.
Repetitions
If you've run your experiment with repetitions, your output results will appear with toggles to view each of the individual runs directly in the table.
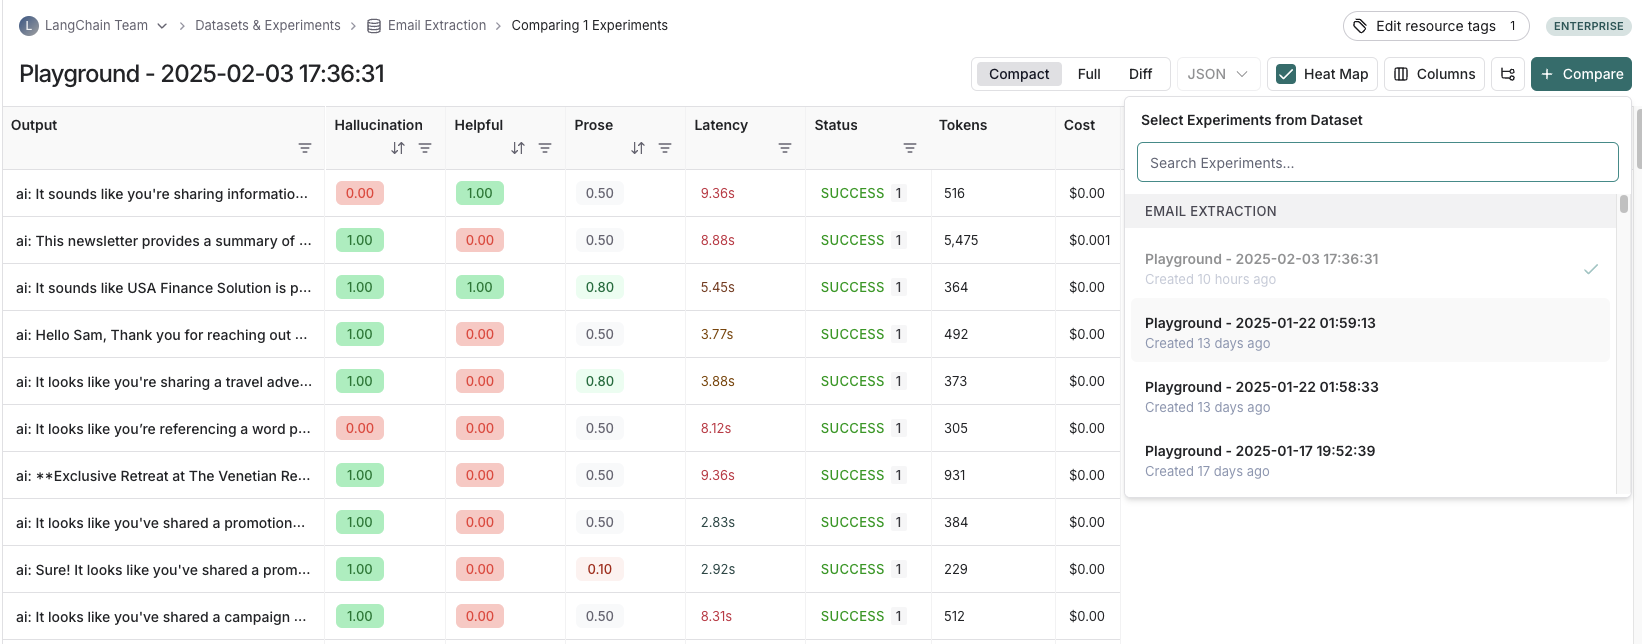
Compare to another experiment
In the top right of the experiment view, you can select another experiment to compare to. This will open up a comparison view, where you can see how the two experiments compare. To learn more about the comparison view, see how to compare experiment results.